Image Details
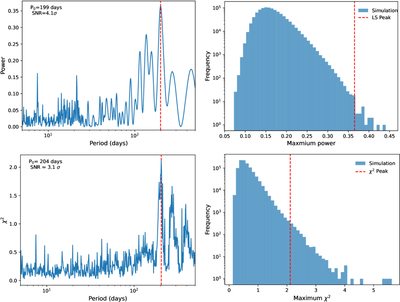
Caption: Figure 2.
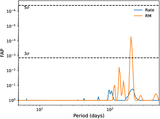
Results of periodicity examinations. Upper left: LSP of RM variations for FRB 20220529, derived from FAST observations. The red dashed line marks the most significant peak at 199 days. The x-axis of the plot is logarithmic. Upper right: simulation results of the LSP. The red dashed line represents the maximum power obtained with the observed RM. In the simulation, RM values were randomly selected and assigned to the time of arrival before applying the LSP. 106 simulations were performed. The probability of obtaining a maximum power greater than or equal to the observed maximum power is 2 × 10⁻⁵. Lower left: results of phase-folding analysis. The red dashed line indicates the period corresponding to the maximum χ2 value, which is 204 days. The x-axis of the plot is logarithmic. Lower right : simulation results of phase-folding analysis. 106 simulations were performed. The probability of obtaining a maximum χ2 greater than or equal to the observed maximum χ2 is 1.0 × 10⁻³.
Other Images in This Article
Copyright and Terms & Conditions
© 2025. The Author(s). Published by the American Astronomical Society.