Image Details
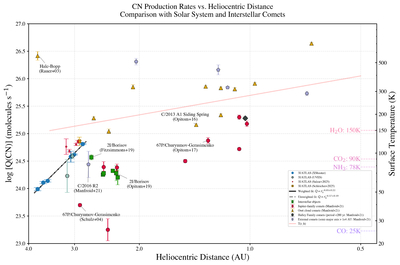
Caption: Figure 4.
CN production versus heliocentric distance: measurements from VLT/X-Shooter (blue circles) and VLT/UVES (teal hexagons) obtained in this work are shown for 3I/ATLAS—the black solid and gray dashed curves are power-law fits to the 3I data only, giving ﹩Q({\rm{CN}})\propto {r}_{h}^{-6.7\pm 0.2}﹩ (weighted) and ﹩Q({\rm{CN}})\propto {r}_{h}^{-6.6\pm 0.2}﹩ (unweighted), respectively. The colored symbols compare with solar system comets compiled from the literature, grouped by dynamical class as in the legend; the green squares mark measurements for 2I. The left axis gives ﹩{\mathrm{log}}_{10}[Q({\rm{CN}})/{\rm{molecules}}\,{{\rm{s}}}^{-1}]﹩ and the bottom axis gives in log scale the heliocentric distance rh (au). The right axis shows an approximate equilibrium surface temperature T(rh). The horizontal dashed lines indicate sublimation thresholds for CO, NH3, CO2, and H2O. Other comet references: H. Rauer et al. (2003), R. Schulz et al. (2004), C. Opitom et al. (2016), C. Opitom et al. (2017), A. Fitzsimmons et al. (2019), C. Opitom et al. (2019), and J. Manfroid et al. (2021).
Other Images in This Article
Copyright and Terms & Conditions
© 2025. The Author(s). Published by the American Astronomical Society.