Image Details
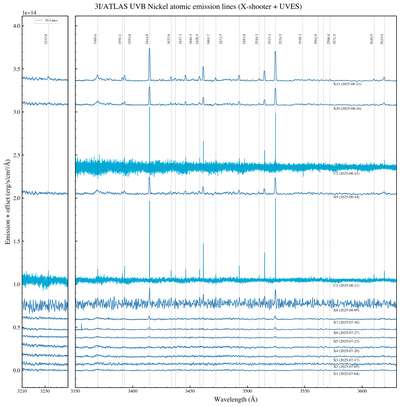
Caption: Figure 1.
Continuum-subtracted UV/blue spectra of 3I/ATLAS showing Ni I emission over 11 VLT/X-Shooter (blue) and two VLT/UVES (cyan) visits. The spectra are vertically offset for clarity, with visit labels and dates indicated. The UVES data are scaled to match X-Shooter continuum noise levels (using visits 9–11 as references) for visualization. Left panel: 3210–3255 Å region showing selected Ni I lines. Right panel: 3350–3630 Å region displaying the full forest of Ni I transitions. The dotted vertical lines mark the laboratory wavelengths of the detected Ni I lines (in angstroms). The emission strengthens toward later epochs, with the first significant detection at rh = 3.78 au in visit X5 (2025 July 23).
Other Images in This Article
Copyright and Terms & Conditions
© 2025. The Author(s). Published by the American Astronomical Society.