Image Details
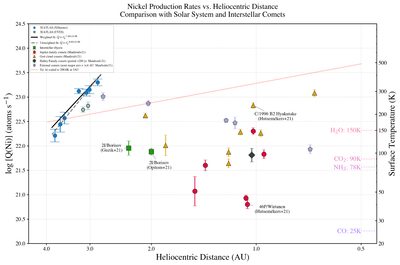
Caption: Figure 3.
Nickel production versus heliocentric distance: measurements from VLT/X-Shooter (blue circles) and VLT/UVES (teal hexagons) obtained in this work are shown for comet 3I/ATLAS—the black solid and gray dashed curves are power-law fits to the 3I data only, giving ﹩Q({\rm{Ni}})\propto {r}_{h}^{-7.7\pm 1.0}﹩ (weighted) and ﹩Q({\rm{Ni}})\propto {r}_{h}^{-8.8\pm 1.0}﹩ (unweighted), respectively. The colored symbols compare with solar system comets compiled from the literature, grouped by dynamical class as in the legend; the green squares mark measurements for 2I. The left axis gives ﹩{\mathrm{log}}_{10}[Q({\rm{Ni}})/{\rm{atoms}}\,{{\rm{s}}}^{-1}]﹩ and the bottom axis gives in log scale the heliocentric distance rh (au). The right axis shows an approximate equilibrium surface temperature T(rh)—orange line, scaled to 200 K at rh = 3 au—to guide the eye (see the text for details). The horizontal dashed lines indicate sublimation thresholds for CO, NH3, CO2, and H2O. Other comet references: P. Guzik & M. Drahus (2021), D. Hutsemékers et al. (2021), J. Manfroid et al. (2021), and C. Opitom et al. (2021).
Other Images in This Article
Copyright and Terms & Conditions
© 2025. The Author(s). Published by the American Astronomical Society.