Image Details
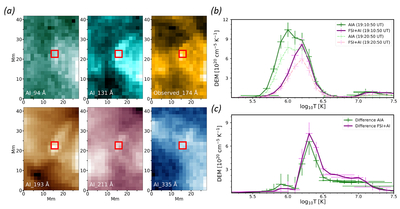
Caption: Figure 5.
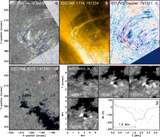
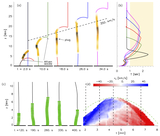
DEMs of the jet region derived from EUV images. (a) The six panels show one EUI/FSI 174 Å image and five AIA-equivalent images generated by deep learning. The red box indicates the pixels used to calculate the DEM. (b) The DEM derived from the SDO/AIA images (green) with AI-generated EUV images with the observed FSI 174 Å image (purple). The solid lines represent the DEM profiles when the jet activity is strong (19:10:20 UT), while the dashed lines correspond to the profiles when the jet diminished (19:20:50 UT). (c) The net DEM calculated from the difference EUV images between the jet maximum and the jet quiet time.
Other Images in This Article
Copyright and Terms & Conditions
© 2025. The Author(s). Published by the American Astronomical Society.