Image Details
Caption: Figure 3.
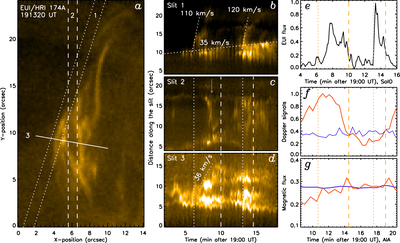
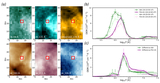
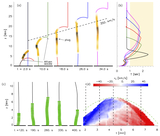
EUV TD maps and time profiles of EUV flux, Hα Doppler motions, and magnetic flux. (a) An EUI/HRIEUV image with slit positions set for the TD maps. (b)–(d) TD maps for EUI along slits 1–3 show upward speeds of 110–120 km s−1 and the evolving helical structure (white arrow). Time profiles of the (e) EUV flux, (f) Hα Doppler shift fluxes, and (g) magnetic fluxes. In (g), the red (blue) curve corresponds to the positive (negative) flux. In (c)–(g), the vertical lines indicate the start (dotted lines) and end (dashed lines) times of the two jets. The animation of panel (a) is from 19:00:00 UT to 19:21:40 UT.
(An animation of this figure is available in the online article.)
(An animation of this figure is available.)
The video/animation of this figure is available in the online journal.
Other Images in This Article
Copyright and Terms & Conditions
© 2025. The Author(s). Published by the American Astronomical Society.