Image Details
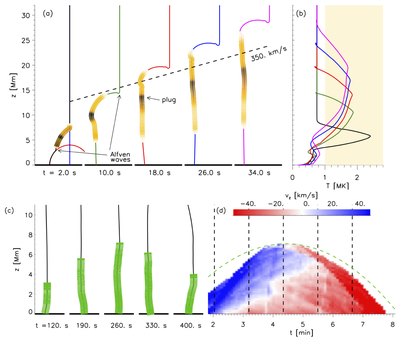
Caption: Figure 6.
The reconnection model illustrated using a thin flux tube simulation. (a) Five snapshots from the initial phase in which the field line (colored curve) relaxes following its formation by reconnection. The pre-reconnection field lines are shown as red and blue curves in the leftmost snapshot. The reverse color scale shows emission measure of hot (T > 106 K) plasma. A dashed diagonal line shows a constant velocity, for reference. (b) The temperature vs. height for the five times using the same colors. The shaded box indicates the hot plasma whose emission is shown in (a). (c) At five later times, a spicule has been launched by the downward Alfvén wave. The green region shows cool (<105 K), dense plasma at each time. (d) The vertical velocity (shaded) in spacetime coordinates. A green dashed parabola shows freefall for reference, and vertical dashed lines show the times of the snapshots.
Other Images in This Article
Copyright and Terms & Conditions
© 2025. The Author(s). Published by the American Astronomical Society.