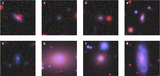
Image Details
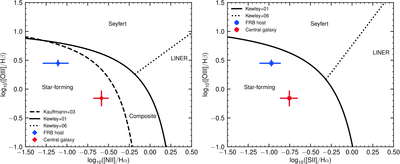
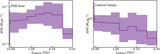
Caption: Figure 9.
BPT diagnostic diagrams for the FRB host galaxy and its central galaxy. Left panel: ﹩{\mathrm{log}}_{10}([{\rm{N}}\,{\rm\small{II}}]/{\rm{H}}\alpha )﹩ vs. ﹩{\mathrm{log}}_{10}([{\rm{O}}\,{\rm\small{III}}]/{\rm{H}}\beta )﹩, with demarcation curves from G. Kauffmann et al. (2003; SF/Composite), L. J. Kewley et al. (2001; Composite/AGN), and the Seyfert–LINER division (L. J. Kewley et al. 2006). Right panel: ﹩{\mathrm{log}}_{10}([{\rm{S}}\,{\rm\small{II}}]/{\rm{H}}\alpha )﹩ vs. ﹩{\mathrm{log}}_{10}([{\rm{O}}\,{\rm\small{III}}]/{\rm{H}}\beta )﹩, showing the SF/AGN curve and the Seyfert–LINER boundary from L. J. Kewley et al. (2001) and L. J. Kewley et al. (2006), respectively. Error bars denote the median and 1σ uncertainties derived from the 16th, 50th, and 84th percentiles of each line ratio.
Other Images in This Article
Copyright and Terms & Conditions
© 2025. The Author(s). Published by the American Astronomical Society.