Image Details
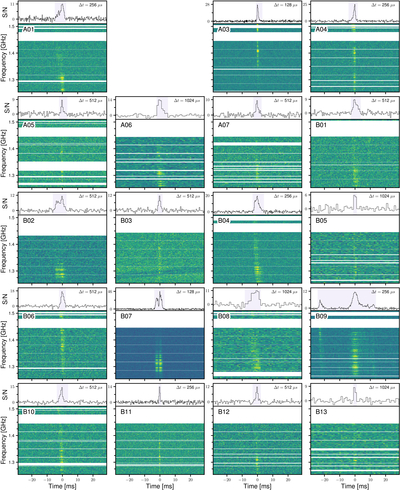
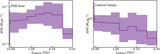
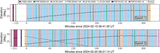
Caption: Figure 2.
Dynamic spectra (bottom panels) and frequency-averaged temporal profiles (top panels) for all bursts. Each burst is coherently dedispersed to a value of 527.723 pc cm−3. The frequency resolution in each dynamic spectrum is 500 kHz, and the respective time resolutions are indicated in the top right of each panel. Horizontal white bands in the dynamic spectra indicate data that have been masked due to RFI or subband edges. Burst labels are the same as in Figure 1. Burst A02 was not found to be robustly astrophysical in origin (Section 3.1.1). Consequently, this panel is left blank.
Other Images in This Article
Copyright and Terms & Conditions
© 2025. The Author(s). Published by the American Astronomical Society.
Copyright ©
2025 Astronomy Image Explorer. All Rights Reserved.