Image Details
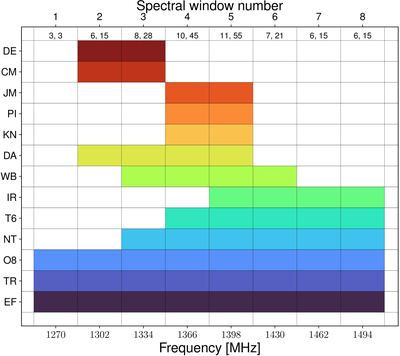
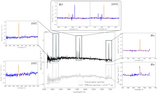
Caption: Figure 7.
Observed frequencies per antenna. Every antenna recorded at least two 32 MHz spectral windows. The numbers below the spectral window number indicate the number of antennas, n, that recorded that spectral window and the corresponding number of unique baselines, ﹩\frac{1}{2}n\left(n-1\right)﹩.
Other Images in This Article
Copyright and Terms & Conditions
© 2025. The Author(s). Published by the American Astronomical Society.
Copyright ©
2025 Astronomy Image Explorer. All Rights Reserved.