Image Details
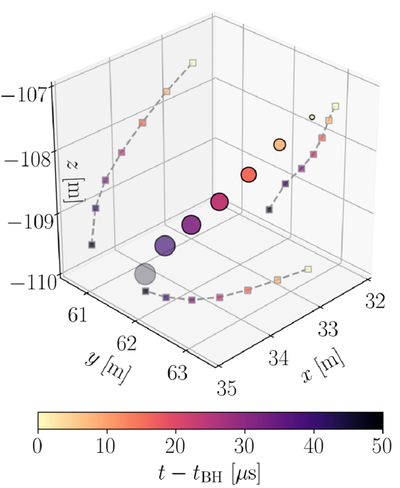
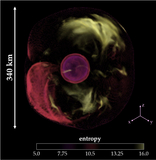
Caption: Figure 5.
Spatial trajectory of the BH as measured by the centroid of the apparent horizon over time. Circle markers in the 3D projection represent the horizon at each time after BH formation, with color indicating time after BH formation tBH in microseconds, and size representing the proper area A of the horizon. The horizon expands at a decreasing rate while the black hole moves along a complex trajectory. 2D projections of this trajectory on each plane are drawn with square markers and connected with dashed gray lines.
Other Images in This Article
Copyright and Terms & Conditions
© 2025. The Author(s). Published by the American Astronomical Society.
Copyright ©
2025 Astronomy Image Explorer. All Rights Reserved.