Image Details
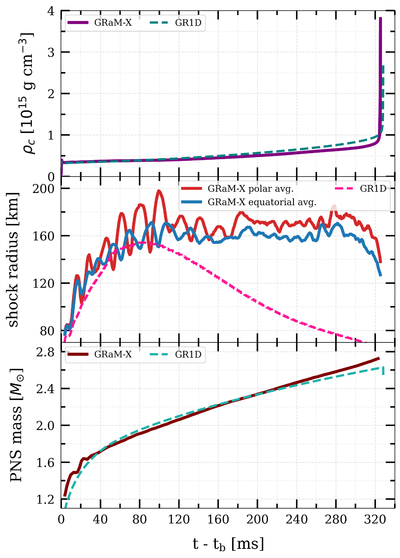
Caption: Figure 2.
Postbounce evolution of the central density (top panel), shock radius (middle panel), and PNS mass (bottom panel) for both our GR1D simulation (dashed lines) and our 3D GRaM-X simulation (solid lines). The 3D evolution of the central density and PNS mass are both closely approximated by the 1.5D evolution. The time of BH formation, where the central density exponentially rises, is also nearly identical between the two simulations. However, the shock radius differs dramatically between the 3D and 1.5D evolution at times after it has reached its maximum value.
Other Images in This Article
Copyright and Terms & Conditions
© 2025. The Author(s). Published by the American Astronomical Society.
Copyright ©
2025 Astronomy Image Explorer. All Rights Reserved.