Image Details
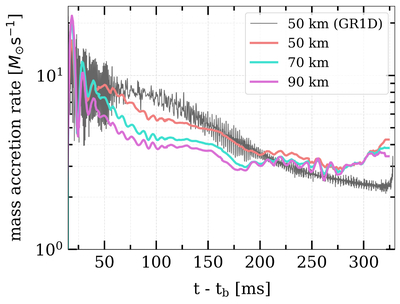
Caption: Figure 3.
The evolution of mass accretion rate, measured in solar masses per second, after core bounce. For the 3D GRaM-X simulation, we show the accretion rate measured through 3 different radii: 50 km (coral), 70 km (turquoise), and 90 km (pink). At early times, the accretion rate is higher through smaller radii, but at late times, the rate converges at a few solar masses per second. We also include the accretion rate measured at 50 km from our GR1D simulation (gray) for comparison; it shows a similar trend to the 3D results but ends with overall lower accretion.
Other Images in This Article
Copyright and Terms & Conditions
© 2025. The Author(s). Published by the American Astronomical Society.
Copyright ©
2025 Astronomy Image Explorer. All Rights Reserved.