Image Details
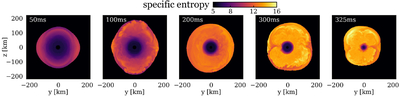
Caption: Figure 1.
Snapshots of the specific entropy s, in units of kB baryon−1, shown as 2D slices through our 3D GRaM-X simulation at various times (from left to right: 50, 100, 200, 300, and 325 ms postbounce). The entropy generally increases from low values (blue) to higher ones (red) as time progresses. The contraction of the core region and the early shock expansion, followed by a later stalling, are also visible. The shock propagation and convective motions exhibit inherent asymmetries. A movie of the simulation is available at this link: https://www.youtube.com/shorts/4sisdNGLUL0.
Other Images in This Article
Copyright and Terms & Conditions
© 2025. The Author(s). Published by the American Astronomical Society.
Copyright ©
2025 Astronomy Image Explorer. All Rights Reserved.