Image Details
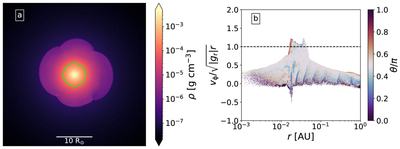
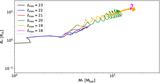
Caption: Figure 7.
Circumstellar disk formed in run R2, visualized at our final simulation snapshot. Left: density slice across the center of the BD, visualized in a top-down view. The lime-colored contour displays the BD surface, defined as all gas having dissociated over 95% of its H2. Right: 2D histogram displaying the distribution of azimuthal velocity normalized by ﹩\sqrt{{g}_{{\rm{r}}}r}﹩ as a function of radius, binned across all cells in the computational domain. The colormap indicates the colatitude θ scaled by π, with θ/π = 0.5 representing the equator, while θ/π = 1 and 0 correspond to the south and north poles, respectively. A dashed line marks the threshold ﹩{v}_{\phi }/\sqrt{{g}_{{\rm{r}}}r}=1﹩.
Other Images in This Article

Copyright and Terms & Conditions
© 2025. The Author(s). Published by the American Astronomical Society.