Image Details
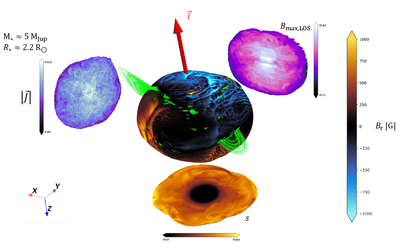
Caption: Figure 2.
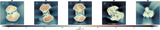
A 3D rendering showing the surface of the BD in R1 when it is 2 weeks old. The color scale displays the radial magnetic field strength on the surface. The green streamlines display closed magnetic loops, meaning field lines that loop from magnetic north to magnetic south on the surface. The red arrow displays the angular momentum axis of the BD. The left and bottom image panels are cross-sectional slices of the interior of the BD, displaying the magnitude of current density (left) and specific gas entropy (bottom). The image panel on the right displays the maximum magnetic field strength along the line of sight (y-axis). The mass and radius of the BD are displayed in the top-left corner.
Other Images in This Article
Copyright and Terms & Conditions
© 2025. The Author(s). Published by the American Astronomical Society.