Image Details
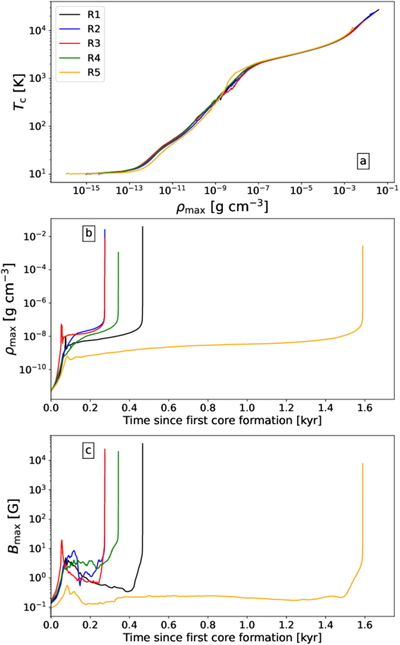
Caption: Figure 1.
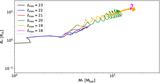
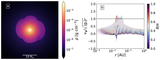
A timeline of the evolution of collapse. Panel (a) displays the temperature-density evolution of the densest cell in our runs. Panels (b), (c) display the maximum density and magnetic field strength as a function of time since first core formation, respectively.
Other Images in This Article
Copyright and Terms & Conditions
© 2025. The Author(s). Published by the American Astronomical Society.
Copyright ©
2025 Astronomy Image Explorer. All Rights Reserved.