Image Details
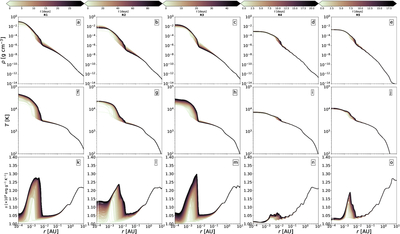
Caption: Figure 4.
Evolution of the density (first row, (a)–(e)), temperature (second row, (f)–(j)), and specific entropy (third row, (k)–(o)), averaged in radial bins and displayed as a function of radius at different times, where t = 0 marks the birth of the BD. Each column corresponds to a different run.
Other Images in This Article
Copyright and Terms & Conditions
© 2025. The Author(s). Published by the American Astronomical Society.
Copyright ©
2025 Astronomy Image Explorer. All Rights Reserved.