Image Details
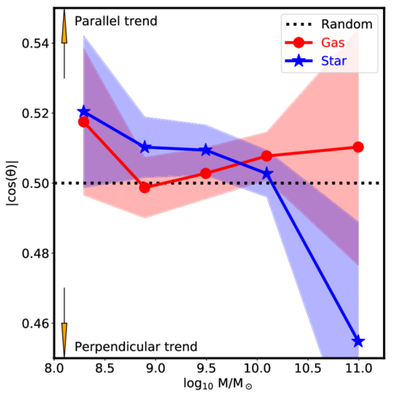
Caption: Figure 2.
The spiral galaxy spin–filament correlation, ﹩| \cos (\theta )| ﹩, as a function of galaxy stellar mass, ﹩{\mathrm{log}}_{10}{M}_{\star }/{M}_{\odot }﹩. The horizontal dotted line (﹩| \cos (\theta )| =0.5﹩) indicates that the galaxy spin is randomly distributed with respect to the filament orientation. The solid blue line with stars and red line with circles represent the stellar and gas components, respectively, as indicated in the legend. The shaded regions in corresponding colors represent the ﹩1/\sqrt{N}﹩ statistical uncertainty, where N is the number of galaxies in each bin. Yellow arrowheads denote trends aligned either parallel or perpendicular.
Other Images in This Article
Copyright and Terms & Conditions
© 2025. The Author(s). Published by the American Astronomical Society.