Image Details
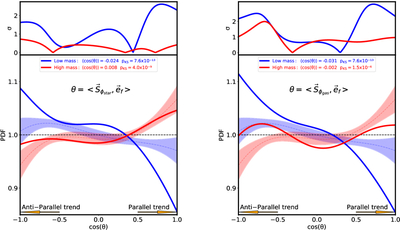
Caption: Figure 3.
The bottom subfigures in each panel show the probability distribution of ﹩{\rm{\cos }}(\theta )﹩, where θ is the angle between the galaxy spin and the filament spin. The left panel presents the spin of the stellar component of galaxies, while the right panel shows the spin of the gas component, as indicated at the top center of each panel. Blue and red solid lines represent low-mass and high-mass galaxies, respectively. The horizontal black dashed line denotes the expected distribution for a uniform random orientation of ﹩{\rm{\cos }}(\theta )﹩. Color-filled regions indicate the 1σ statistical uncertainties derived from 10,000 null-hypothesis realizations. The mean value of ﹩{\rm{\cos }}(\theta )﹩ and the p-value from the Kolmogorov–Smirnov (KS) test (pKS) are displayed at the top center. Aligned and antialigned trends are highlighted with yellow arrows. The upper subfigures in each panel show the discrepancy, in standard deviation units of the randomized distribution, between the observed curve and the mean of the random distributions as a function of ﹩{\rm{\cos }}(\theta )﹩.
Other Images in This Article
Copyright and Terms & Conditions
© 2025. The Author(s). Published by the American Astronomical Society.