Image Details
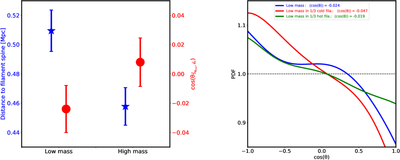
Caption: Figure 4.
Left panel: the average distance (represented by blue lines with star symbols, corresponding to the left y-axis) and ﹩{\rm{\cos }}(\theta )﹩ values (shown in red lines with solid circles, corresponding to the right y-axis) are plotted for both low-mass and high-mass galaxies. Error bars indicate the 1σ uncertainties. Right panel: similar to the bottom-left panel of Figure 3, but shows the effect of filament dynamical temperature. The low-mass galaxy sample is divided into two subsamples based on the dynamical temperature of their host filaments. The red and green lines represent the lowest and highest one-third of the sample in terms of filament dynamical temperature, respectively.
Other Images in This Article
Copyright and Terms & Conditions
© 2025. The Author(s). Published by the American Astronomical Society.