Image Details
Caption: Figure 1.
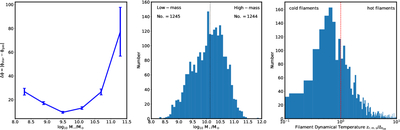
Left panel: the position angle misalignment, Δϕ ≡ ϕstar − ϕgas, between stellar and gas components as a function of galaxy stellar mass, ﹩{\mathrm{log}}_{10}({M}_{\star }/{M}_{\odot })﹩. The blue line with error bars corresponds to spiral galaxies. Error bars represent typical 1σ uncertainties. Middle panel: the number distribution of spiral galaxies as a function of galaxy stellar mass, ﹩{\mathrm{log}}_{10}({M}_{\star }/{M}_{\odot })﹩. Galaxies are divided into two subsamples of almost equal size according to the ﹩{\mathrm{log}}_{10}({M}_{\star }/{M}_{\odot })=10.118﹩, indicated by the vertical dotted line. Right panel: the distribution of filament dynamical temperature ﹩{z}_{\mathrm{rms}}/{{\rm{\Delta }}}_{{{\rm{Z}}}_{\mathrm{AB}}}﹩ (see Section 2.2 for more details). Filaments are divided into either “cold” or “hot” by ﹩{z}_{\mathrm{rms}}/{{\rm{\Delta }}}_{{{\rm{Z}}}_{\mathrm{AB}}}=1﹩, as indicated by the vertical red dotted line.
Other Images in This Article
Copyright and Terms & Conditions
© 2025. The Author(s). Published by the American Astronomical Society.