Image Details
Caption: Figure 4.
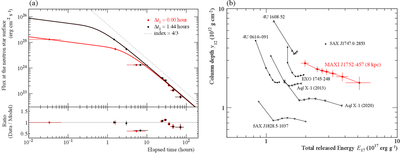
(a) Evolution of the bolometric blackbody flux at the NS surface assuming the source distance of MAXI J1752−457 at 8 kpc in the log-log format. The blackbody parameters are obtained by the 2–10 keV fitting (Figure 3 and Table 1). The observed data are shown in red and black marks, corresponding to the assumptions of the burst onset time at Δt0 = 0.00 hr (i.e., the first MAXI scan of the detection) and Δt0 = 1.44 hr, respectively. The analytical models are overlaid at the best-fit parameters in Equation (3) of E17 = 2.0 and y12 = 2.8 for the Δt0 = 0.00 hr (red marks), whereas E17 = 5.1 and y12 = 1.8 for the Δt0 = 1.44 hr (black marks). Each reduced χ2 is 3.16 (d.o.f. = 6) and 3.50 (d.o.f. = 6), respectively. (b) Comparison of the observed burst energy E17 and column depth y12 of MAXI J1752−457 (red symbol) with previously reported long-duration bursts (black symbols) (M. Serino et al. 2016). In the same way as M. Serino et al. (2016), each data point of MAXI J1752−457 corresponds to the different assumptions of the burst onset at Δt0 = 0.00, 0.24, 0.48, 0.72, 0.96, 1.20, and 1.44 hr.
Other Images in This Article
Copyright and Terms & Conditions
© 2025. The Author(s). Published by the American Astronomical Society.