Image Details
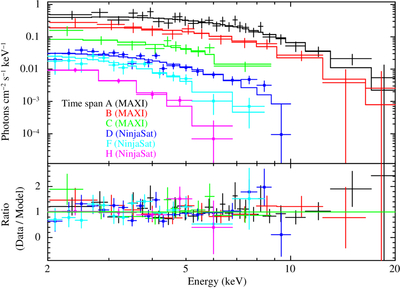
Caption: Figure 3.
The fitted X-ray spectra of MAXI/GSC and NinjaSat/GMC using the absorbed blackbody model. The time spans A, B, and C correspond to MAXI/GSC, with no markers. The time spans D, F, and H correspond to NinjaSat/GMC, represented by circular markers. The time spans are shown in Figure 2(a). The upper panel displays the unfolded spectrum, while the lower panel shows the ratio of the data to the best-fitting model (see Table 1).
Other Images in This Article
Copyright and Terms & Conditions
© 2025. The Author(s). Published by the American Astronomical Society.
Copyright ©
2025 Astronomy Image Explorer. All Rights Reserved.