Image Details
Caption: Figure 2.
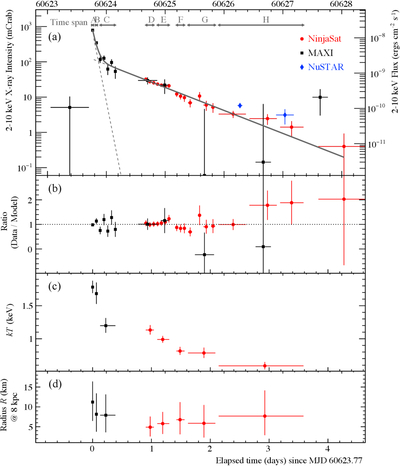
(a) The 2–10 keV light curves of MAXI J1752−457 observed with NinjaSat/GMC (red circles), MAXI/GSC (black squares), and NuSTAR/XRT (blue diamonds; S. Pike et al. 2024) presented in the mCrab unit between MJD 60235 (November 11) and 60632 (November 18). NuSTAR fluxes were taken from S. Pike et al. (2024). The NinjaSat/GMC data are shown with the bin size of 1.5 hr on MJD 60624.6–60626.5, 3.0 hr on MJD 60626.5–60627.4, and 6.0 hr after MJD 60626.5. The X-ray intensities with MAXI and NinjaSat are converted to the Crab unit and then to the flux unit (see details in the main text). Each time span for spectral fittings is indicated in the upper part of the figure. (b) The ratio of data to the best-fit curve (Equation (2)) of panel (a) (see the main text). (c) The blackbody temperature. (d) The blackbody radius of the blackbody model at the assumed distance of 8 kpc (Table 1).
Other Images in This Article
Copyright and Terms & Conditions
© 2025. The Author(s). Published by the American Astronomical Society.