Image Details
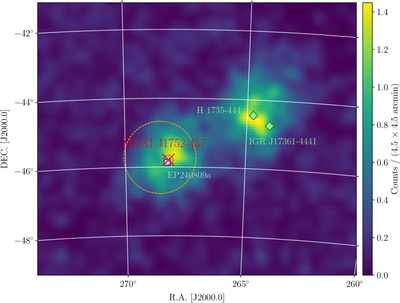
Caption: Figure 1.
The MAXI/GSC 2.0–10.0 keV image obtained between MJD 60623.5 and 60624.0 after being smoothed with a Gaussian filter of its Gaussian kernel of 2 pixel (9﹩\mathop{.}\limits^{{\rm{^{\prime} }}}﹩0). The color map is shown in a unit of integrated X-ray counts at each 4﹩\mathop{.}\limits^{{\rm{^{\prime} }}}﹩5 × 4﹩\mathop{.}\limits^{{\rm{^{\prime} }}}﹩5 pixel. The positions of MAXI J1752−457 reported by MAXI and EP240809a by Swift are shown as the red cross and blue square markers, respectively (H. Y. Liu et al. 2024; M. Serino et al. 2024). The MAXI 1σ error region is shown as the dashed red circle, whereas the reported EP240809a (Swift) error circle is invisibly small in this plot. The NinjaSat GMC boresight direction and the 2﹩\mathop{.}\limits^{\unicode{x000b0}}﹩1 FOV are shown in the orange cross and orange dashed circle, respectively. The nearby X-ray sources H 1735−444 and IGR J17361−4441 (green diamonds) are outside of the NinjaSat FOV.
Other Images in This Article
Copyright and Terms & Conditions
© 2025. The Author(s). Published by the American Astronomical Society.