

Image Details
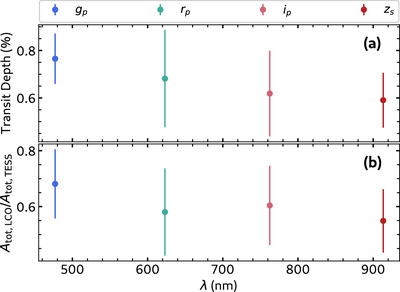
Caption: Figure 9.
Properties of the single transit observed with LCOGT multiwavelength photometry. The points are plotted at approximately the central wavelength of the four MuSCAT3 bandpasses. (a) A comparison of measured transit depths across the four LCO bandpasses. (b) Integrated area beneath each LCOGT light curve (Atot,LCO) relative to that measured from TESS (Atot,TESS). The total absorption is the integrated area beneath the model transit profile ﹩{ \mathcal T }(\phi )﹩ that is fit to the observed data.
Other Images in This Article
Show More
Copyright and Terms & Conditions
© 2025. The Author(s). Published by the American Astronomical Society.

Copyright ©
2026 Astronomy Image Explorer. All Rights Reserved.
