

Image Details
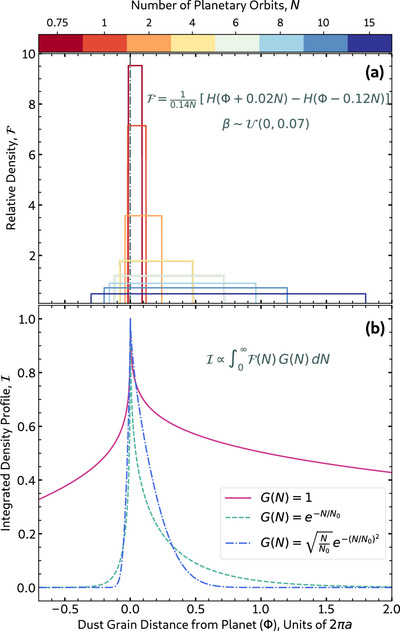
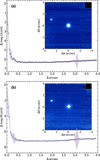
Caption: Figure 10.
(a) Distribution of dust grain distances from the planet over time for an impulsive dust ejection event. The colored curves represent different numbers of elapsed orbits since the release. Values of β are drawn from a uniform distribution ﹩{ \mathcal U }﹩, while H denotes the Heaviside function. (b) A steady-state dust tail profile, shown as the integral of the dust distribution over time weighted by a decay function G(N), characterized by a scale number N0. The decaying profiles both use N0 = 2, specifically chosen such that the resulting decay of the dust density visually resembles plausible transit profiles of BD+05 4868 A in Figure 8.
Other Images in This Article
Show More
Copyright and Terms & Conditions
© 2025. The Author(s). Published by the American Astronomical Society.

