

Image Details
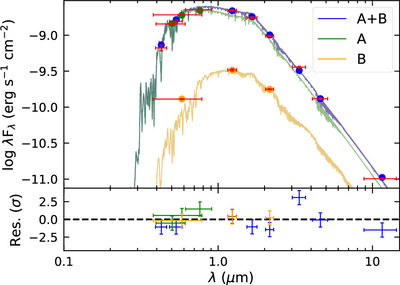
Caption: Figure 6.
Spectral energy distribution (SED) of BD+05 4868 AB. The crosses show the observed broadband photometry, with horizontal widths indicating the filter bandwidths. The circles represent the model fluxes in the corresponding bands. Colors denote whether the observation corresponds to the primary star (green), secondary star (yellow), or the blended pair (blue). The bottom panel shows the deviations between the data and the model divided by the photometric uncertainties. For illustrative purposes, we also show the R. L. Kurucz (1993) model atmospheres for the best-fitting stellar models. These models were not used directly in the fit, although they were used to generate the MIST bolometric correction tables.
Other Images in This Article
Show More
Copyright and Terms & Conditions
© 2025. The Author(s). Published by the American Astronomical Society.

