

Image Details
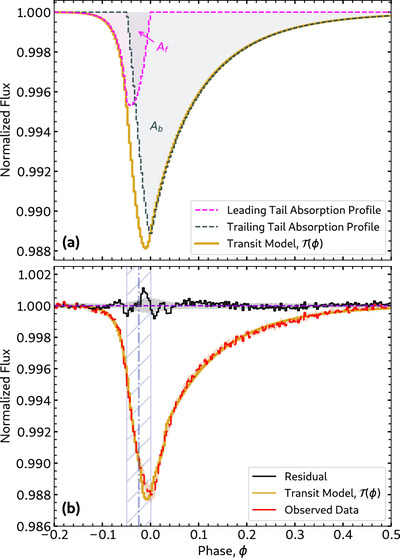
Caption: Figure 7.
The fit to the mean transit profile of BD+05 4868 A using the transit model ﹩{ \mathcal T }(\phi )﹩, which convolves the dust extinction profile ﹩{ \mathcal Y }(d)﹩ (Equation (1)) with the stellar disk. (a) Decomposition of ﹩{ \mathcal Y }(d)﹩ as a superposition of two generalized-Gaussian distributions representing the trailing and leading tails of the dust cloud. The areas beneath the extinction profiles described by these distributions are indicated by Ab and Af, respectively. (b) Comparison of the model fit with the observed mean transit profile from TESS data (red). The blue vertical line at ϕ = −0.024 indicates when the planet crosses the central longitude of the host star, with the hatched region indicating the star’s diameter.
Other Images in This Article
Show More
Copyright and Terms & Conditions
© 2025. The Author(s). Published by the American Astronomical Society.

