

Image Details
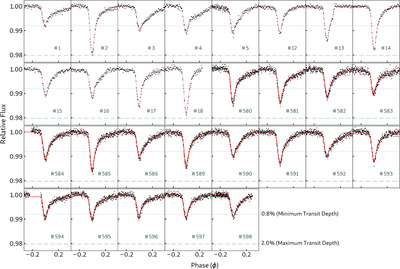
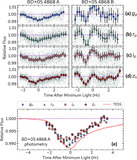
Caption: Figure 8.
Individual transits of BD+05 4868 Ab from the TESS light curve. Transits are numbered based on the cycle count from the first transit at t0,#1 = 2459798.2587 (BJD), taking into account the presence of gaps in the light curve. Transits 1–18 are from TESS Sector 55, while Transits 580–598 are from TESS Sector 82. The mean transit depth across these transits is 1.2%. Also indicated are the minimum (0.8%, dashed line) and maximum (2.0%, dotted line) transit depths across these observations. The red curve in each panel represents the model transit profile ﹩{ \mathcal T }(\phi )﹩ (Equation (1)) that is fit to each transit individually.
Other Images in This Article
Show More
Copyright and Terms & Conditions
© 2025. The Author(s). Published by the American Astronomical Society.

