Image Details
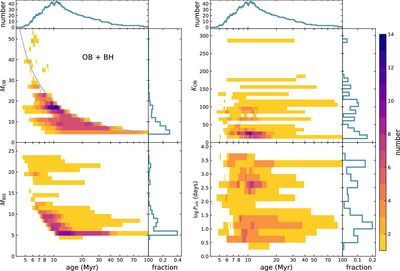
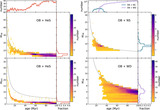
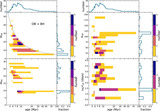
Caption: Figure 4.
Predicted properties of OB+BH binaries as a function of cluster age. The color coding represents the number density of these binaries in each pixel. The left panels display the mass distribution of OB stars and BHs, whereas the right panels show the distribution of the semiamplitude orbital velocity of OB stars and current binary orbital periods. The gray line in the upper left panel depicts the turnoff mass as a function of cluster age. The step plots at the top and right margins of the main panels represent 1D projections. Notably, the 1D projection on the right side is normalized to unity, taking into account the duration of binaries possessing specific properties.
Other Images in This Article
Show More
Copyright and Terms & Conditions
© 2024. The Author(s). Published by the American Astronomical Society.