Image Details
Caption: Figure 1.
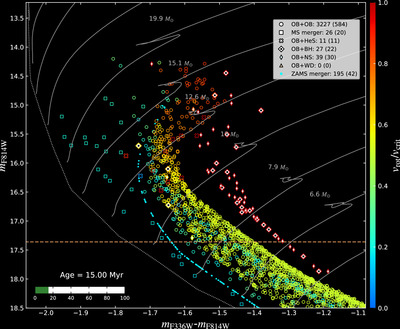
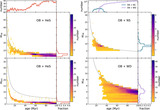
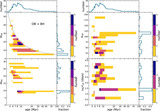
Distribution of our models in the CMD at 15 Myr, matching the estimated age of NGC 2100. Each symbol indicates a binary system or a binary merger product, color-coded according to the rotation of the visually brighter component. We classify our models into different groups: detached binaries containing two OB MS stars (open circles), MS merger products (open squares), OB+HeS binaries (open crosses), OB+BH binaries (thick diamonds with dots inside), OB+NS binaries (thin diamonds), OB+WD binaries (triangles), and merger products of two ZAMS stars (filled dots). For OB stars rotating at velocities higher than 95% of their critical values, we reduce the red magnitude, m F814W, by 0.1 mag to account for potential decretion disk flux (J. Labadie-Bartz et al. 2017). Gray solid curves depict evolutionary tracks of single-star models with initial rotational velocities of 55% of their critical values, and the gray dotted line marks nonrotating ZAMS positions. The orange dashed line indicates the magnitude 2.5 mag below the cluster turnoff. The numbers outside and inside the parentheses in the legend indicate the total number of simulated models and the number of models above the orange dashed line, respectively, for each stellar population. Here we adopt a distance modulus of 18.82, representative of the SMC cluster NGC 330 (C. Wang et al. 2022). This figure captures a snapshot from an animation depicting the distribution of our models from 2 to 100 Myr. The full animation has a duration of 27 s.
(An animation of this figure is available in the online article.)
(An animation of this figure is available.)
The video/animation of this figure is available in the online journal.
Other Images in This Article
Show More
Copyright and Terms & Conditions
© 2024. The Author(s). Published by the American Astronomical Society.