Image Details
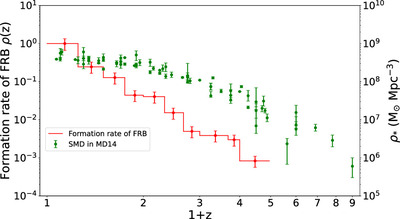
Caption: Figure 8.
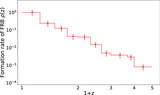
Comparison between the FRB rate and the observed SMD. The red line represents the formation rate of FRBs, and the green dots represent the observed SMD (P. Madau & M. Dickinson 2014). All error bars are at a 1σ confidence level.
Other Images in This Article
Copyright and Terms & Conditions
© 2024. The Author(s). Published by the American Astronomical Society.
Copyright ©
2026 Astronomy Image Explorer. All Rights Reserved.