Image Details
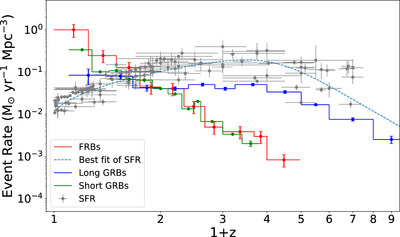
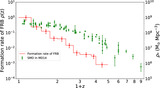
Caption: Figure 7.
Comparison between the formation rate of FRBs and other events. The red line represents the formation rate of FRBs. The green and blue lines represent the rates of short GRBs (G. Q. Zhang & F. Y. Wang 2018) and long GRBs (H. Yu et al. 2015), respectively. The gray dots and blue dashed line correspond to the observed SFR and the best fit (A. M. Hopkins & J. F. Beacom 2006), respectively.
Other Images in This Article
Copyright and Terms & Conditions
© 2024. The Author(s). Published by the American Astronomical Society.
Copyright ©
2026 Astronomy Image Explorer. All Rights Reserved.