Image Details
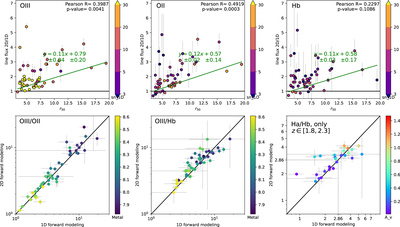
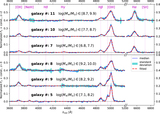
Caption: Figure 6.
Comparison between the emission line fluxes derived using the 2D/1D forward-modeling methods, explained in detail in Sections 3.1 and 3.5, respectively. The top three panels show the galaxy radius vs. the flux ratio of 2D to 1D for each line. The 2D fluxes are tangibly higher than 1D fluxes (above the black line), and it seems systematic for all three brightest lines of each source (with the same r 50). We find a correlation between them (green line), although not so strong, with the Pearson correlation coefficients and the p-value exhibited in the top right corner, as well as the green result of linear fitting at the center. Their color marks the S/N of the flux from the 1D method, showing no significant correlation. The bottom three panels show the line flux ratio, while their color marks the metallicity or the dust extinction derived in Section 3.2 using the GRIZLI flux ratio. These two distributions nearly scatter across the equality line (in black) within the uncertainty. But there are several outliers and a slight systematic overestimation for 2D, which is more obvious for Hα/Hβ at the bottom right.
Other Images in This Article

Copyright and Terms & Conditions
© 2024. The Author(s). Published by the American Astronomical Society.