Image Details
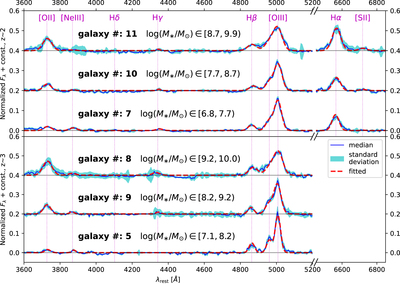
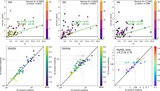
Caption: Figure 4.
Stacked grism spectra for galaxies residing in several mass bins at two redshift ranges, as shown in the upper (1.8 < z < 2.3) and lower (2.6 < z < 3.4) panels, respectively. Each mass bin contains 5 ∼ 11 galaxies, with the exact number of galaxies and corresponding mass range highlighted above each stacked spectrum. In each set of spectra, the blue curves represent the median stacked spectrum, the cyan bands mark the standard deviation flux uncertainties, and the red dashed curves show the best-fit Gaussian fits to multiple emission lines, while [S II] and Hα are across a discontinuous range among other lines (i.e., the [O III] λ λ 4960,5008 doublets, Hβ, Hγ, Hδ, [Ne III], and [O II]) in the broken axes at the right parts. The details of the stacking procedures are presented in Section 3.5.
Other Images in This Article

Copyright and Terms & Conditions
© 2024. The Author(s). Published by the American Astronomical Society.