Image Details
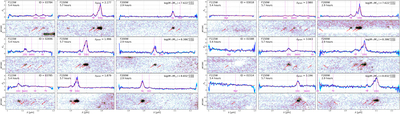
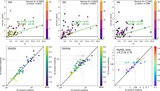
Caption: Figure 1.
1D/2D spectra of six galaxies in our sample. Left: three examples at z = 1.8–2.3. The forward-modeled spectra, optimally extracted 1D observed flux F λ (in units of [10−19 erg/s/cm2/Å]), and its 1σ uncertainty, are represented by the red and blue solid lines and the cyan shaded bands, respectively. The 2D grism spectra covered in three filters (F115W, F150W, and F200W) are continuum-subtracted. Right: same as the left panel, but at z = 2.6–3.4.
Other Images in This Article

Copyright and Terms & Conditions
© 2024. The Author(s). Published by the American Astronomical Society.
Copyright ©
2025 Astronomy Image Explorer. All Rights Reserved.