Image Details
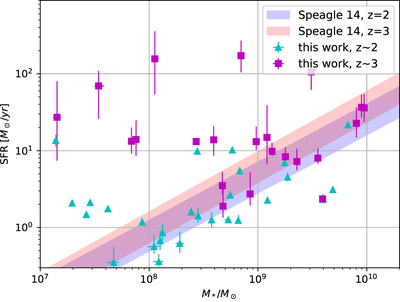
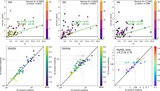
Caption: Figure 2.
SFR–M * relation for our galaxy sample, where the low- and high-redshift individual measurements are marked in cyan triangles and magenta squares. As a comparison, we also show the star-forming main sequence fitted by Speagle et al. (2014) with ±0.2 dex scatters. Sanders et al. (2021) give results fairly close to their extrapolated best fit out to ﹩\mathrm{log}({M}_{* }/{M}_{\odot })=9﹩.
Other Images in This Article

Copyright and Terms & Conditions
© 2024. The Author(s). Published by the American Astronomical Society.
Copyright ©
2025 Astronomy Image Explorer. All Rights Reserved.