Image Details
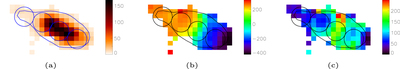
Caption: Figure 4.
Velocity maps generated by fitting a single Gaussian to the [Ar II]6.99 μm line in each spaxel. Regions are the same as Figure 1. (a) S/N maps; values are ratios of integrated signal in the fitted line to the quadrature sum of the uncertainties of the spectral elements used. (b) Velocity centroid in kilometers per second relative to the adopted systemic velocity. (c) Dispersion of the fitted line in kilometers per second.
Other Images in This Article
Copyright and Terms & Conditions
© 2023. The Author(s). Published by the American Astronomical Society.
Copyright ©
2026 Astronomy Image Explorer. All Rights Reserved.