Image Details
Caption: Figure 1.
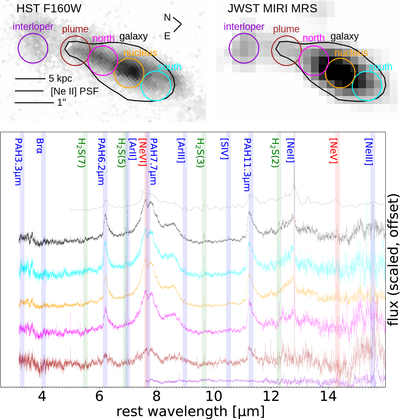
Top row: collapsed image of all four MRS spectral cubes and HST F160W (rest-frame optical) image, with a 4σ MRS detection contour (full galaxy aperture, black) and five selected regions (colored circles). Bottom: spectra extracted from the full galaxy aperture and the five subregions, and the archival IRS spectrum (top thin spectrum). The IRS slit is close to the size of the entire MRS field of view. Spectra are normalized and offset for visual clarity, and color coded the same as the regions. The vertical shaded bands mark key spectral features.
Other Images in This Article
Copyright and Terms & Conditions
© 2023. The Author(s). Published by the American Astronomical Society.
Copyright ©
2026 Astronomy Image Explorer. All Rights Reserved.