Image Details
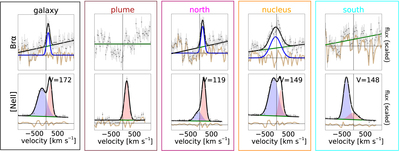
Caption: Figure 2.
Cutouts of the extracted spectrum around Brα (top) and [Ne II] (bottom), with best-fit Gaussian models. For [Ne II], red- and blueshifted components are shown, and one half of the peak-to-peak velocity differences are indicated. The tan curve at the bottom is the residual between the data and the continuum+Gaussian(s) model.
Other Images in This Article
Copyright and Terms & Conditions
© 2023. The Author(s). Published by the American Astronomical Society.
Copyright ©
2026 Astronomy Image Explorer. All Rights Reserved.