Image Details
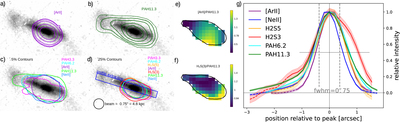
Caption: Figure 3.
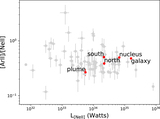
(a), (b) Contours generated from the narrowband images for [Ar II] and PAH11.3 (convolved to the spatial resolution of [Ne II]12.81 μm) overlaid on the HST F160W image. The dashed contour indicates the 2σ detection threshold, as determined by the rms noise in background areas of the narrowband images. The solid contours are 50%, 25%, 10%, and 5% of the peak value in the narrowband images. (c) 5% contours for select emission features. (d) 25% peak levels for select emission features. All contours are generated from the narrowband images convolved to the spatial resolution of [Ne II], except the 5% PAH 3.3 μm contours, where the faintness of the spectrum meant that convolved image was dominated by noise. (e), (f) Ratio maps of the [Ar II] and H2S(3) lines to PAH11.3 derived from the narrowband images, normalized to their respective average values. (g) Normalized spatial profiles extracted from the rectangular aperture in panel (d). The contours become dashed when they are below the 2σ threshold. All the emission features are more extended than the [Ne II]12.81 μm beam (vertical dashed lines).
Other Images in This Article
Copyright and Terms & Conditions
© 2023. The Author(s). Published by the American Astronomical Society.