Image Details
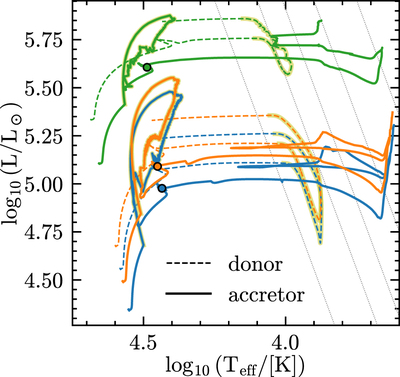
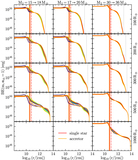
Caption: Figure 1.
H-R diagram of the binary systems. The thin dashed lines show the evolution of the donors until RLOF detachment, the solid lines show the accretors from ZAMS, through RLOF (marked by a yellow outline), until core carbon depletion. Dots with black outlines mark the accretor’s TAMS (not shown for donor). The thin dotted lines mark constant radii of R = 100, 200, 300, 500, 1000 R ⊙; all models have Z = 0.0019, an initial orbital period of 100 days, and initial masses of 38 and 30 M ⊙ (green), 20 and 17 M ⊙ (orange), 18 and 15 M ⊙ (blue).⏬ ✎
Other Images in This Article
Copyright and Terms & Conditions
© 2023. The Author(s). Published by the American Astronomical Society.