Image Details
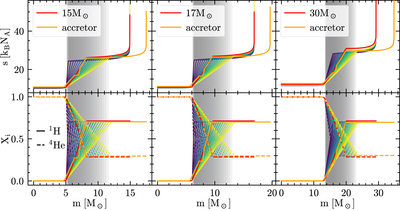
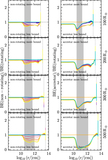
Caption: Figure 10.
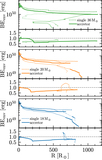
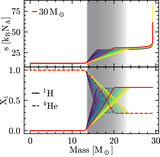
Specific entropy (top row), H (bottom row, solid lines), and He (bottom row, dashed lines) profiles for nonrotating single stars (red), accretors (orange), and “engineered” models of the same total mass as the ZAMS mass of the accretors. The overlapping gray bands emphasize the CEB region, increasing in size from blue to yellow in the engineered models.
Other Images in This Article
Copyright and Terms & Conditions
© 2023. The Author(s). Published by the American Astronomical Society.
Copyright ©
2025 Astronomy Image Explorer. All Rights Reserved.