Image Details
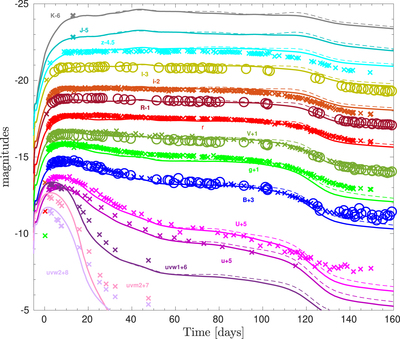
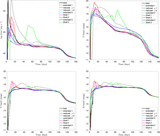
Caption: Figure 4.
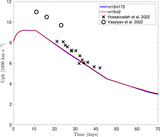
Broadband light curves for models m15ni175 (thick curves) and m15ni2 (dashed curves), together with SN 2021yja. Crosses represent the observations taken from Hosseinzadeh et al. (2022), and circles represent data taken from Vasylyev et al. (2022). The statistical uncertainties of the observations are smaller than the data points. Time “0” corresponds to the explosion epoch introduced by Hosseinzadeh et al. (2022). The synthetic curves are shifted by −8 days to match the early phase and the end of the plateau.
Other Images in This Article

Copyright and Terms & Conditions
© 2022. The Author(s). Published by the American Astronomical Society.
Copyright ©
2026 Astronomy Image Explorer. All Rights Reserved.