Image Details
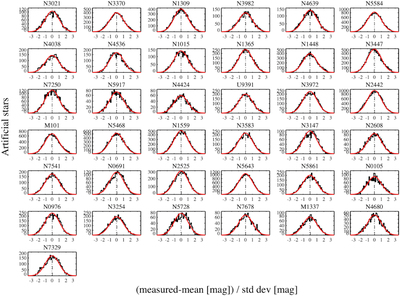
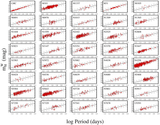
Caption: Figure 7.
Distributions of recovered artificial stars in each host. For each real Cepheid, 100 artificial stars of the expected Cepheid magnitude (based on its period and the P–L relation) are added to the host images within an annulus with an outer radius of 2.″4 and measured following the same procedures as for the Cepheids to produce a distribution in magnitudes (log flux). The distributions for each host are combined after subtracting their mean and dividing by their standard deviation. They compare well to a Gaussian with a difference in median and mean (dashed and dotted lines) of ∼0.03σ.
Other Images in This Article
Show More
Copyright and Terms & Conditions
© 2022. The Author(s). Published by the American Astronomical Society.
Copyright ©
2026 Astronomy Image Explorer. All Rights Reserved.