Image Details
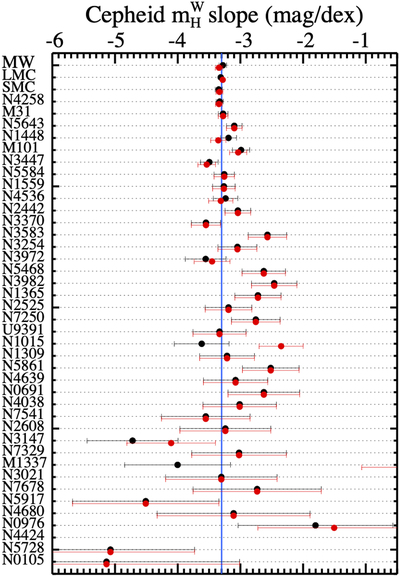
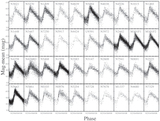
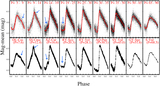
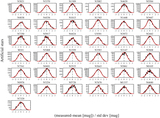
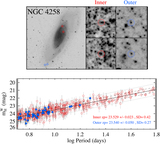
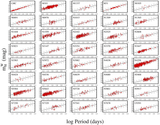
Caption: Figure 10.
Independent determinations of the slope of the P–L relation in each host plotted in order of precision. Black (red) points are after (before) outlier rejection. We find that the slopes are consistent with a single value of −3.27 to −3.30 as indicated by the blue line. The most metal poor (SMC) and metal rich (MW) also have consistent slopes. Error bars are for the fit error only and do not include uneven period sampling or background covariance. The large change in slope for Mrk 1337 was due to the relatively small sample size and rejection of a few Cepheids far from its center.
Other Images in This Article
Show More
Copyright and Terms & Conditions
© 2022. The Author(s). Published by the American Astronomical Society.
Copyright ©
2026 Astronomy Image Explorer. All Rights Reserved.