Image Details
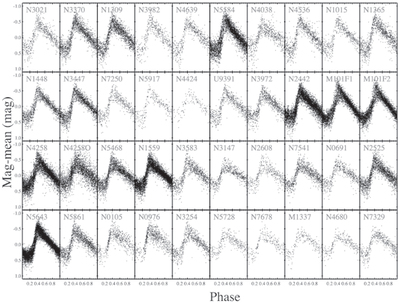
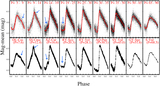
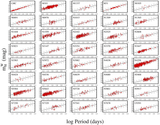
Caption: Figure 5.
Composite visual (F555W) or white-light (F350LP) Cepheid light curves. Each HST Cepheid light curve with 10 < P < 80 days is plotted after subtracting the mean magnitude and determining the phase of the observation.
Other Images in This Article
Show More
Copyright and Terms & Conditions
© 2022. The Author(s). Published by the American Astronomical Society.
Copyright ©
2026 Astronomy Image Explorer. All Rights Reserved.