Image Details
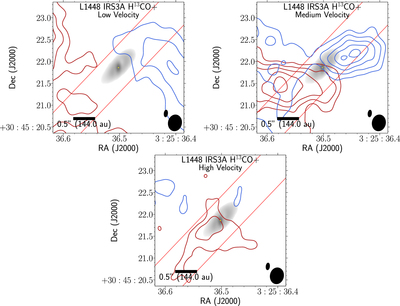
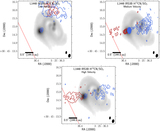
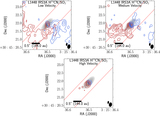
Caption: Figure 8.
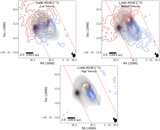
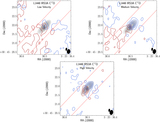
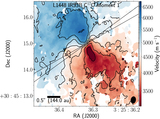
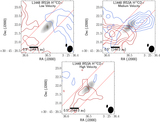
H13CO+ integrated intensity map toward IRS3A generated at a position angle of 125°, whose emission predominately traces the intermediate dense, gaseous material of the inner envelope. The image is tapered with a 400 kλ Gaussian to best reduce the amount of noise and show the proper resolution to the spatial scales shown. The H13CO+ emission might trace a velocity gradient across the source, but the lack of strong emission coming from the disk itself hinders resolving the kinematics. The columns correspond to low-, medium-, and high-velocity ranges. The following panel descriptions will be noted red (blue), corresponding to the Doppler shifted emission. Low velocity: velocity ranges 5.2 ﹩\to ﹩ 6.5 km s−1 (4.1 ﹩\to ﹩ 5.2 km s−1), contours start at 5σ (5σ) and iterate by 2σ (2σ) with the 1σ level starting at 0.004 (0.007) Jy beam−1 for the red (blue) channels. Medium velocity: velocity ranges 6.5 ﹩\to ﹩ 7.4 km s−1 (3.0 ﹩\to ﹩ 4.1 km s−1), contours start at 3σ (3σ) and iterate by 2σ (2σ) with the 1σ level starting at 0.003 (0.003) Jy beam−1 for the red (blue) channels. High velocity: velocity ranges 7.4 ﹩\to ﹩ 8.6 km s−1 (1.8 ﹩\to ﹩ 3.0 km s−1), contours start at 3σ (3σ) and iterate by 2σ (2σ) with the 1σ level starting at 0.002 (0.0025) Jy beam−1 for the red (blue) channels. The H13CO+ synthesized beam (0.″85 × 0.″52) is the bottom rightmost ellipse on each of the panels, and the continuum synthesized beam (0.″11 × 0.″05) is offset diagonally.
Other Images in This Article
Show More
Copyright and Terms & Conditions
© 2021. The American Astronomical Society. All rights reserved.